Driving Neuroinclusive Data Experience in Enterprise Solutions

How much users’ emotional reactions change based on the solution they interact with? Read our report for insights from our emotional tracking study and practical advice on creating solutions that support all user groups.

Neurodiversity at Work

Around 17% of the U.S. workforce is neurodivergent. This represents a significant share of specialists and experts in the job market, who may need specific conditions to fulfil their potential and deliver business value.

Some companies already have identified this opportunity and started adjusting their recruitment processes and work environments, but the crucial area of neuroinclusive design of IT solutions remains unexplored. That’s why neurodivergent talent constitutes 36% of our research’s participants.
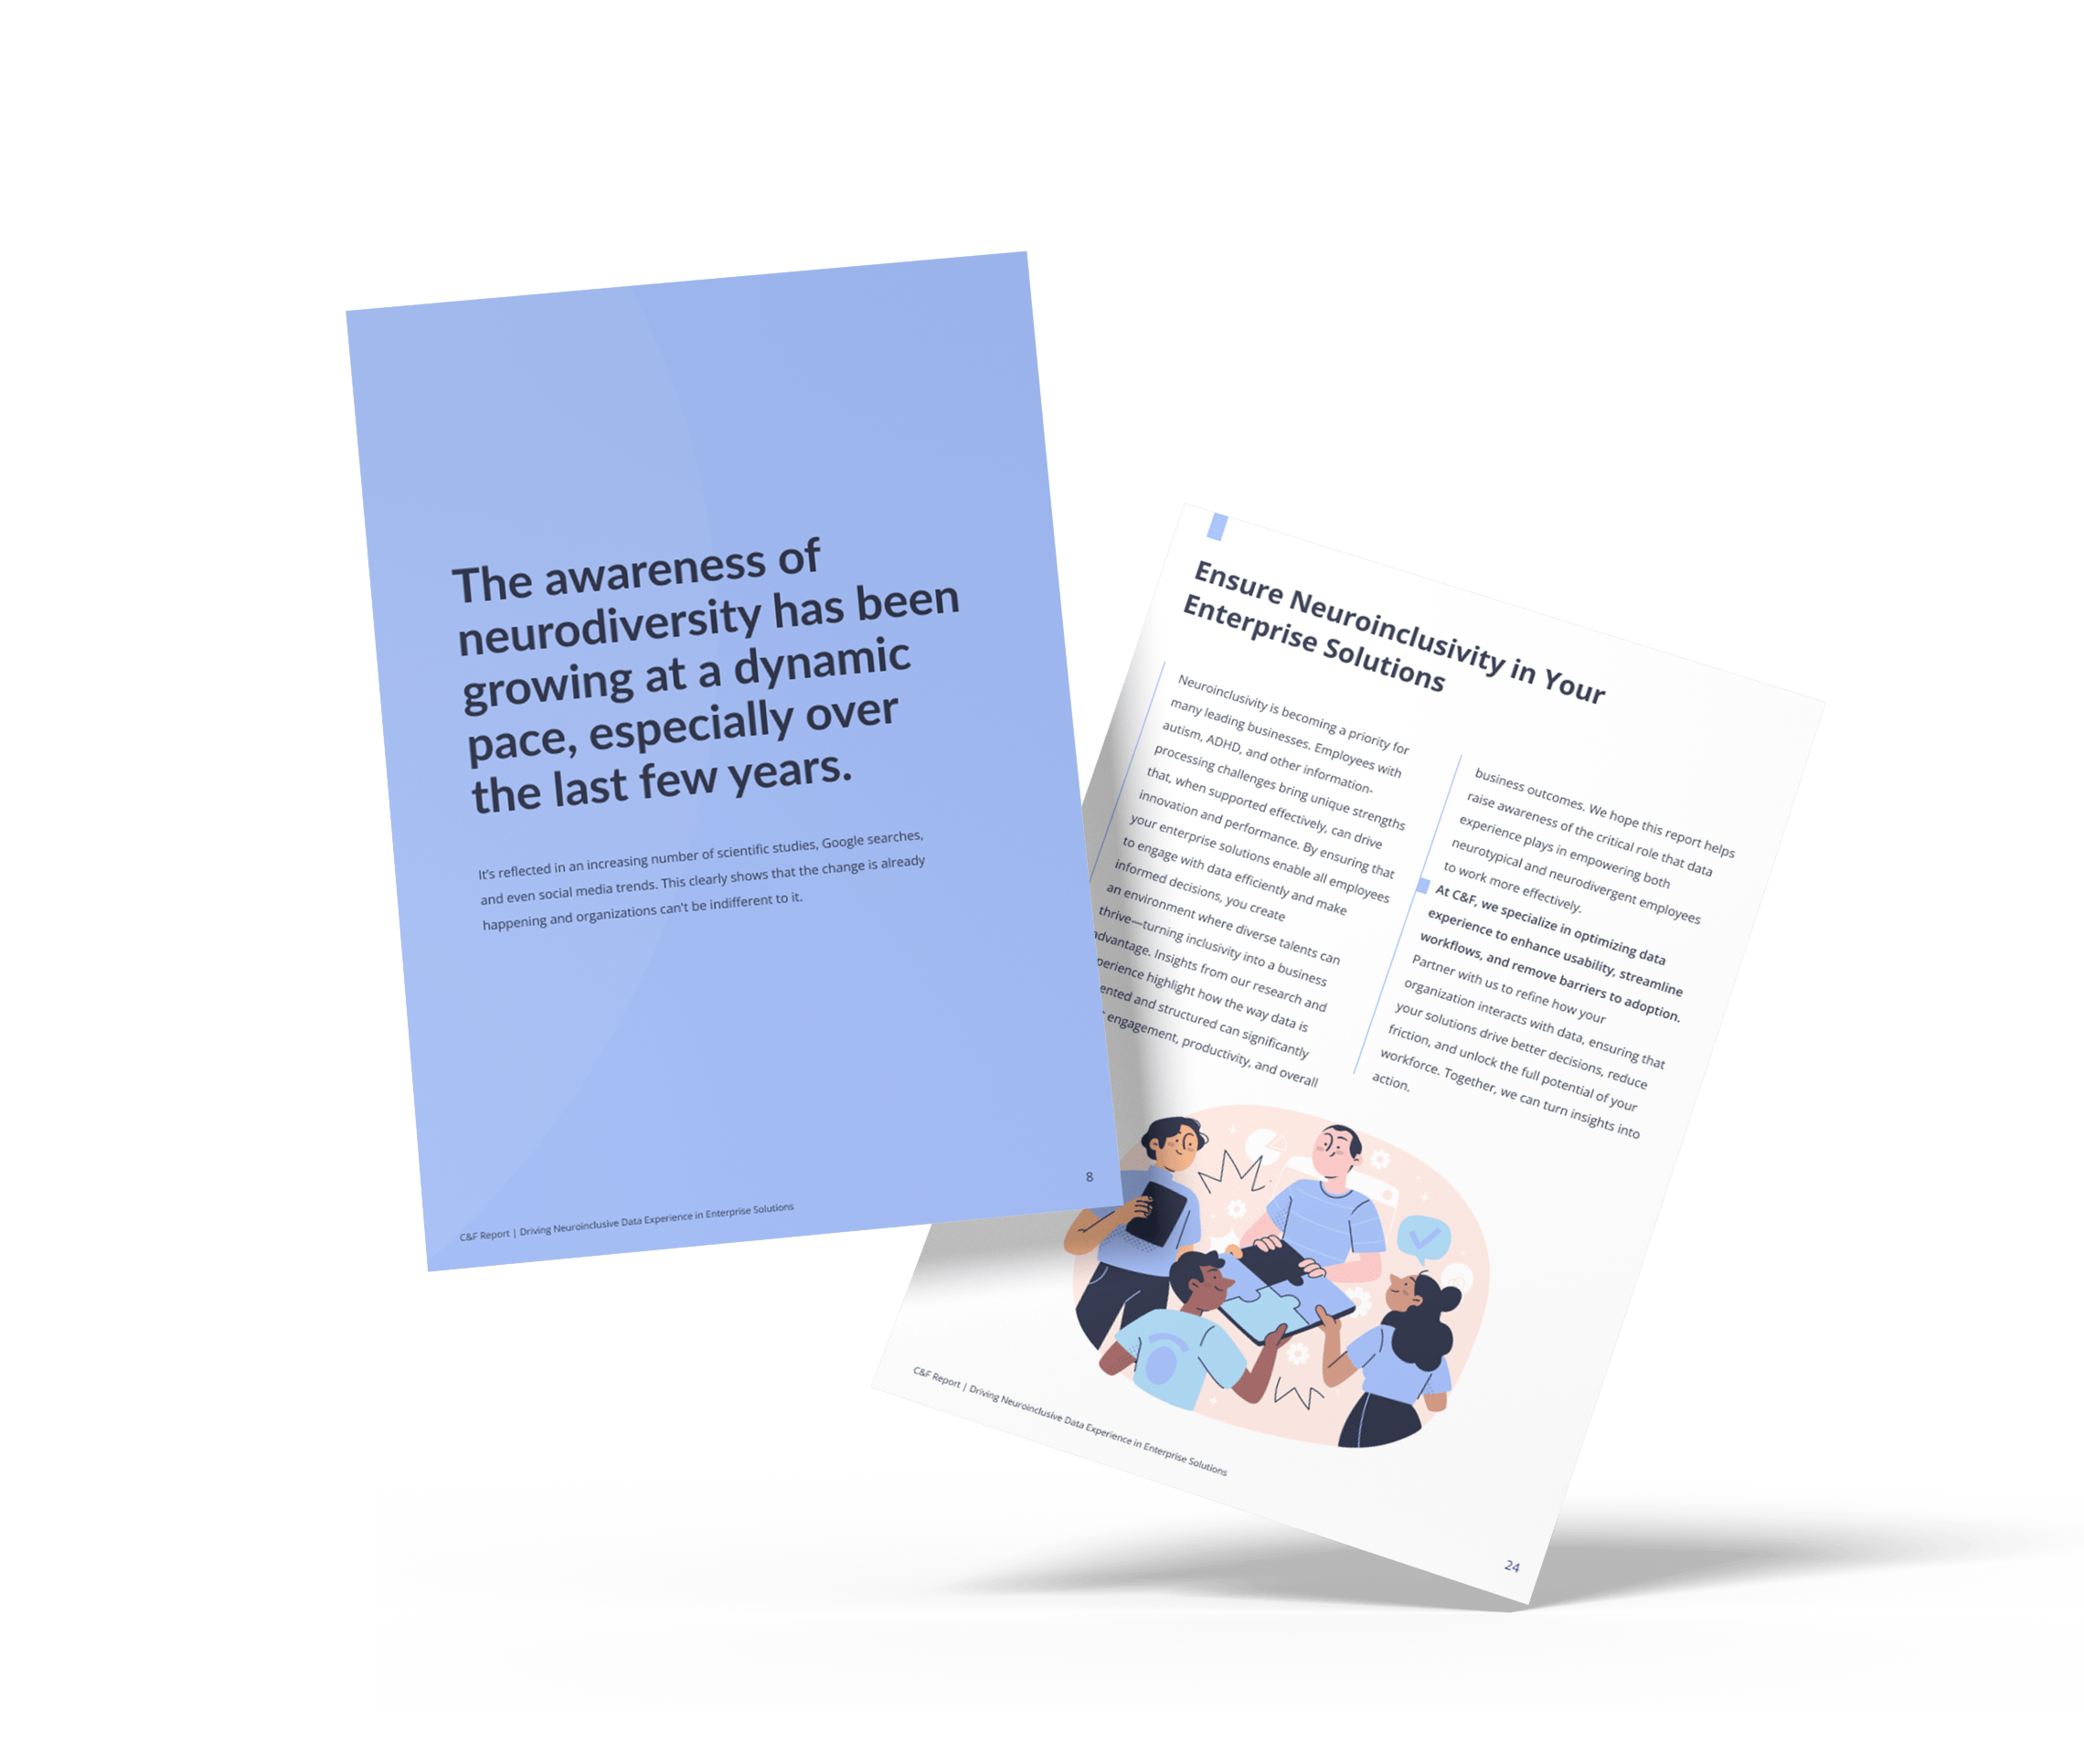
Download the report to:

  • Gain insights from our face-tracking research and see how users react to different dashboard designs.
  • Verify whether agreed best practices of UX design actually translate to user perception.
  • Look at the dashboard designs used in the research and see the data visualization methods that increased user engagement and positive emotions.
  • Get practical tips on creating neuroinclusive enterprise solutions that serve the needs of neuroatypical and neurotypical users.

Emotional Tracking Insights for a Wider Adoption of BI Tools

Ensure neuroinclusivity in your enterprise solutions. Apply the best practices provided in our report to support both neurotypical and neurodivergent employees. By following our guidelines, you can achieve:

Icon showing two people in front of a screen

+74% growth in user engagement

-19% decrease in anger

+254% in positive emotions for edge cases

+224% users able to find all necessary information

Boost Efficiency with Better Data Experiences

Download the report now to see how neuroinclusive design drives BI adoption and user satisfaction.