
- 1. In the current stage of the evolution of data analytics, collecting data, ensuring its quality, processing it, and leaving the rest to the analysts is a standard, established practice, much like cars coming equipped with air conditioning. However, there is one often overlooked aspect that, when addressed, can significantly enhance your analytics process. And by “significantly,” I mean, for instance, achieving three times your current analysis speeds or up to six times higher data inference speeds. What is this crucial element?
- 2. Unfolding chapter
- 3. The final stretch
- 4. The costs of not doing it right
In the current stage of the evolution of data analytics, collecting data, ensuring its quality, processing it, and leaving the rest to the analysts is a standard, established practice, much like cars coming equipped with air conditioning. However, there is one often overlooked aspect that, when addressed, can significantly enhance your analytics process. And by “significantly,” I mean, for instance, achieving three times your current analysis speeds or up to six times higher data inference speeds. What is this crucial element?
In the past, gaining a competitive advantage was all about having access to data and using it to make better decisions than your rivals. Then, everyone started collecting data in various formats (like Excel files, text files, and printed reports), and whoever had more or better-trained analysts had an edge in accessing and analyzing that data.
Later, the era of dashboards arrived – a time of data visualization, automation, big data and report democratization. Nowadays, as most companies are already using data to make data-driven decisions, the focus shifted towards intelligent and advanced analytics, utilizing NLP/NLG, ML algorithms, and automation. This has highlighted the importance of empowering non-experts with analytical capabilities.
Unfolding chapter
So, data analytics has evolved a far cry from that stage when individuals with specific analytical skills worked with data while business users were merely recipients of the results of their analyses. The landscape has changed. Business users are now actively engaging with reports, even though their analytical skills may be different or less advanced. This emphasizes the importance of the analytical entry point, where well-designed reports become crucial. They enable individuals without deep data analysis expertise to effectively utilize the insights and findings from these reports.
But the increasing democratization of data analysis, coupled with the growing support from technology, doesn’t necessarily mean the end of the story. There is still at least one more step to take in gaining a competitive edge through data: enhancing the analytics experience.
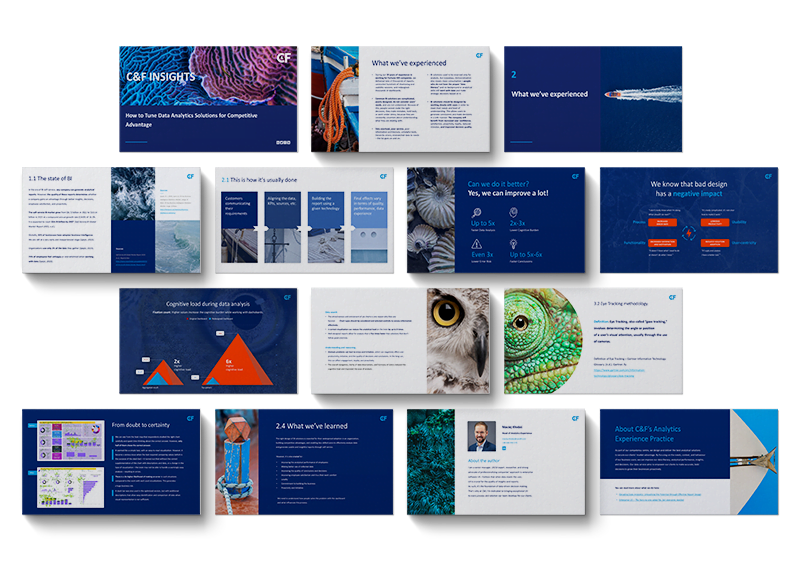
This can be achieved by designing reports that are easy to read and interpret and thus, really insightful, empowering, but first of all – lowering the analytical entry point and increasing the data literacy of the organization as a whole. As a proof of this statement, our team prepared the C&F Insights publication.
Today, the key to empowering employees to make data-driven decisions is to instill in them the confidence and courage to make decisions independently. But to make this happen, employees must understand data. This is a necessary condition.
Recently, using eye-tracking technology, we conducted research at C&F to examine how the design of an analytical report impacts its recipient and the quality of their data work. The findings revealed that well-designed reports allow for 2x-3x faster analysis, enabling users to quickly identify the desired areas and insights within the report. Moreover, they facilitate 5x-6x faster data inference while maintaining a high level of confidence in providing accurate answers and identifying correct data points. Additionally, well-designed reports result in 2x-3x lower cognitive load, making them easier to read and extract information from. This translates to up to 3x lower risk of errors compared to poorly designed reports.
The final stretch
An analytical report is a document that presents data and their analysis on a specific topic or problem, whose goal is to inform decision-making. These documents can vary in length and complexity, depending on the subject matter and the users’ needs. They can cover a range of topics, including market research, financial analysis, performance evaluations, and more.
Let’s imagine for a moment, that an organization – with all of its IT systems and trained personnel, data sets, and millions invested in data management and quality control, is a production line. The production line produces analytical reports as the end product. Can the end product fail to meet expectations, despite the well-functioning production line? In the case of analytical reports, this happens all too often.
The costs of not doing it right
Reading data on dashboards and reports should eventually let people find sufficient information to perform their daily tasks. However, this is not always the case, and the cost of such inadequacies can include time, frustration, decreased productivity, high analytical burden, missed opportunities, uncertainty, and the stress of making decisions with limited knowledge. This can potentially lead to erroneous decisions, loss of confidence, lack of initiative, decreased team loyalty, and diminished sense of value.
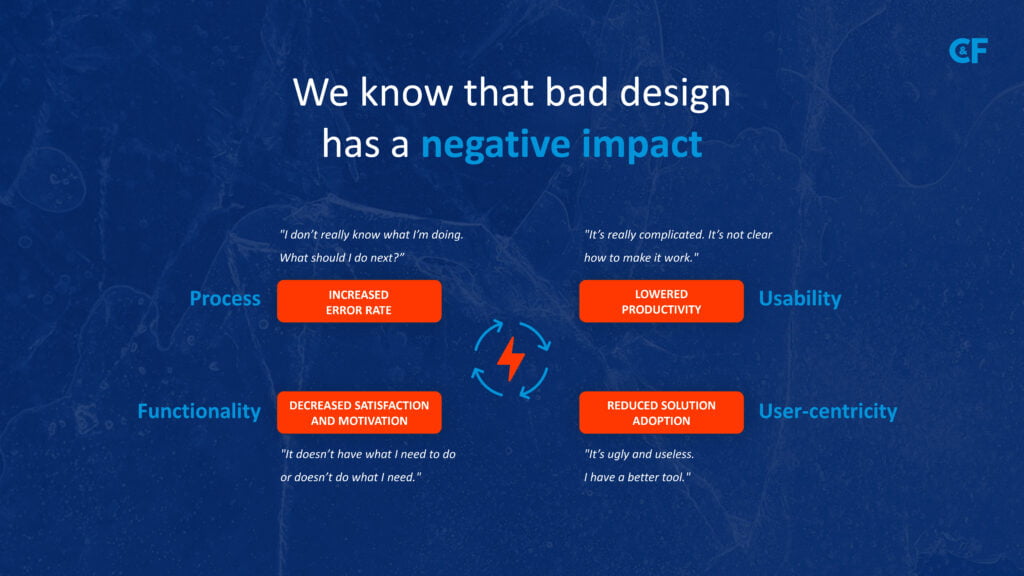
These costs result from how a dashboard or report is constructed, designed, and tailored to a specific audience (their objectives, the context of data usage, behaviors). The elements we use, such as colors, title sizes, descriptions, nomenclature, data hierarchy, visualizations, and layout, individually may have a relatively small impact, with some elements exerting more influence than others. Without paying attention to these elements, we significantly increase the risk of building a less useful report that is harder to analyze, generates higher analytical costs, and results in lower quality insights and decisions.
Even if an organization has advanced technical data solutions, what ultimately counts is the report and how the end-user interprets and uses the data. Designing an excellent data analysis experience eliminates uncertainty and helps build confidence in decision-making, leading to better business outcomes. Therefore, investing in UX design in analytics can be the key to success in today’s data-driven business world.
Yes, data itself is an invaluable asset, but it is the generation of quality insights that drives actions based on data analysis. By prioritizing effective data design, organizations can unleash the hidden potential within their data and empower employees to make informed decisions. This leads to increased job satisfaction, higher levels of engagement, and a stronger competitive edge in the data-driven business world.
The journey of data analytics goes beyond data collection and processing. It encompasses the art of designing meaningful reports, fostering positive analytical experiences, and enabling employees to harness the power of data. By embracing these principles, organizations can transform their data into a strategic asset and drive success in today’s data-driven era.
Would you like more information about this topic?
Complete the form below.