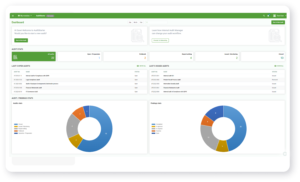
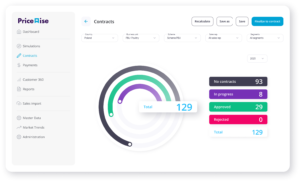
How to achieve consistency in your data visualizations?

Standardize data presentation, enhance usability, and foster better cooperation between BI teams and users. With ready templates, custom guides, and unified design standards, we streamline development, reduce cognitive load, and increase adoption rates, ensuring professional and consistent data products.

Standardize Your Data Visualizations

Ensure consistency and quality in your data products with our comprehensive Data Design Standards service.

Elevate Data Trust and Usability

Improve data trust and usability with standardized design elements, reducing errors and enhancing decision-making.

Streamline Your BI Solutions

Achieve coherence across all data platforms and technologies, making data analysis faster and more precise.

Boost Adoption and Satisfaction

Increase user satisfaction and adoption rates with intuitive, user-friendly data products designed for consistency.

In today's data-driven world, consistency and quality in data visualization are critical. Our service ensures professional, user-friendly data products that enhance data trust and usability, streamline analysis, and increase adoption rates, ultimately driving better business decisions and outcomes.

Why Standardize Your Data Products?

Feedback from users often highlights issues such as excessive links, numerous KPIs, and too many platforms, which hinder usability and adoption. By standardizing the form of presented data, we can facilitate better cooperation between internal BI teams and business users, increasing satisfaction by delivering tools that are both usable and appealing.

Short Term Benefits

Immediate steps include the creation of a Core Design System, establishing the foundation for consistent and high-quality data products.

Long Term Benefits

Expansion and enrichment of the Core Design System into a BI Cooperation Hub, complete with a reports library, training materials, a knowledge base, and adaptable dashboard templates. This helps designers and developers quickly create trustworthy, accessible, and consistent experiences.

Addressing Key Challenges

1

Discrepancies Between Environments

Different platforms and technologies often lack common design elements and layout approaches.

2

Complex Usability

Overly complex features, poorly designed flows, and a convoluted ecosystem of technology and tools.

3

Low Trust and Usability

Users find it hard to trust data due to poorly designed interfaces, making it difficult to digest information.

4

Low Adoption

Users struggle to find relevant information in a complex ecosystem, resulting in low adoption rates.

5

Inconsistency

Varied aesthetic quality, lack of standard design patterns, and poorly designed interfaces across different solutions.

How Data Design Standards Deliver Value

Ready Templates

Kick-start projects with pre-designed templates, speeding up development and lowering costs.

Tailored Solutions

Custom guides for KPIs, visuals, layouts, information hierarchy, information architecture, data correlations, and data types ensure solutions meet specific area expectations.

Unified Design Standards

Achieve coherence across all solutions, flattening the learning curve for new users and ensuring easy switching between technologies.

Improved Analysis

Up to 5 times faster and more precise analysis, with defined analytical patterns.

Reduced Cognitive Burden

2-3 times lower cognitive load, improving data literacy and usability.

Lower Error Rates

Up to 3 times fewer errors, enhancing decision-making processes.

Higher Adoption Rates

Improved user satisfaction, proactiveness, and initiative, with easy switching between environments.

Our Approach

  • Start Small: Select three key reports to benchmark and assess the scope of elements used. 
  • Analyze Core Products: Identify common design patterns and recommendations. 
  • Build Core Design System: Develop templates, color schemes, typography, element examples, layouts, best practices, and example visuals. 
  • Develop Data Experience Corporate Identity: Establish general rules for BI solutions. 
  • User Feedback: Select power users to gather feedback and enrich the library with area-specific elements. 
  • Training and Adoption Monitoring: Implement training plans and monitor adoption rates. 
  • Transform into BI Cooperation Hub: Create a comprehensive hub with a reports library, training materials, and a knowledge base. 

What you get

UX Standards and Best Practices

Detailed descriptions and instructions published to a web portal, always up-to-date. 

Design Files

Access to Figma design files, including landing pages and category pages. 

BI Report Templates

Up to 6 layout templates in respective formats to kick-start projects

Color Palette

A comprehensive color palette for BI dashboards, available as a static scheme with gradients, examples, shades, and XML format for instant usage. 

Custom Shapes and Icons

A set of up to 60 custom elements in PNG format. 

Helping clients
drive digital change globally

Discover how our comprehensive services can transform your data into actionable business insights,
streamline operations, and drive sustainable growth. Stay ahead!

Explore our Services

See Technologies We Use

At the core of our approach is the use of market-leading technologies to build IT solutions that are cloud-ready, scalable, and efficient. See all
Figma
AdobeXD

Let's talk about a solution

Our engineers, top specialists, and consultants will help you discover solutions tailored to your business. From simple support to complex digital transformation operations – we help you do more.