- 1. Never before has so much data been available for businesses to use. Data volumes and complexities are increasing exponentially each year. This drives companies to seek new, innovative ways to get the most out of it. So how can companies gather the highest-value information that removes guesswork and takes them from data-initiated companies to data-driven companies that innovatively use data?
- 2. Introduction
- 3. What are the 4 steps of the data journey?
- 4. Going from ‘data’ to ‘insight’ – reaching data maturity
Never before has so much data been available for businesses to use. Data volumes and complexities are increasing exponentially each year. This drives companies to seek new, innovative ways to get the most out of it. So how can companies gather the highest-value information that removes guesswork and takes them from data-initiated companies to data-driven companies that innovatively use data?
Introduction
Statista estimates that we can expect to see 120 zettabytes of data generated by the end of 2023. That’s one billion terabytes of digital information created in a single year. For comparison, 2010 only saw around two zettabytes of data created. And 2025 is projected to produce over 180 zettabytes of data. It’s clear that extracting usable insights from this wealth of information is becoming paramount to make decisions that positively impact the business.
In this article, we look at the process behind taking raw data and changing it into information we can use. This approach involves bringing our data through well-defined steps that allow us to do just that. Starting from data ingestion, moving through the stages of integration and data analysis followed by visualization, allows us to transform this digital gold into insights. However, the data journey doesn’t solely revolve around data transformation; it also outlines the optimal approach to accomplishing this task in order to facilitate a company’s evolution into a Data-Centric, data-driven entity through innovative data architecture.
What are the 4 steps of the data journey?
Transforming data into something we can understand and put to work can be a complicated task. But converting raw data into actionable insights requires some vital steps in a journey that ensures the data we’re using is high quality, reliable, and accessible.
Data governance and DataOps are essential elements of the data journey. They enhance each step. They ensure that the transformation of data points into something we can interpret, see, and understand is elevated. Let’s take a look at how it all works.
Step 1: Defining, finding, and collecting data
The first stage of the data journey involves recognizing which data we’re looking for. We begin by considering the factors that essentially define what it is. We then identify and engage in data collection itself, bearing in mind the business needs, and make sure we’re accessing the suitable sources in the right way. This lays the foundation for Data Source Management.
- Data about data
In order to understand what data a company is ingesting, it helps to define the factors that describe data, like type, source, format, security constraints, size, etc.
This can be done before data is collected or, if you already acquired the raw data but don’t know what it contains, you’ll need to think about the processes, tools and technologies available to derive information from it.
- Finding the correct data
Data governance plays a crucial role in finding the correct data. It determines the rules and standards for acquiring data. These principles help us to ensure that the data collected is accurate, relevant, and in line with legislation. Data governance outlines the guidelines for data ownership, management, and classification. This, in turn, forms the basis for the ensuing steps.
- Collecting data with purpose
Collected data should also be cataloged into a central repository. This enhances the collection phase and helps eliminate data silos. It provides a capacity to accurately document, classify, and describe these critical data assets into a Data Catalog. This also allows for efficient data discovery and selection by analysts and data scientists. Authorized and trusted data sources reinforce access to the correct data in line with data governance principles and enable the right data management practices.
Appropriate data identification and collection and retention policies must align with business goals. The step should reflect desired business outcomes and consider budget expectations. Decision-makers can then ensure that only the most relevant customer data is collected from various sources. These can include lead time data, customer metrics, online traffic performances, and macroeconomic indicators for each analysis.
Concerns about cloud migration, data use, infrastructure, and security needs should also be answered. This serves to enhance the process of collecting data.
Step 2: Processing and cleaning data
Since we’ve mastered the art of storing and collecting data, the challenge of how to refine and use it effectively represents the next data journey stage.
Once data has been collected, in most cases, it is gathered into a repository and stored in unrefined, often unstructured formats. This data must be processed, beginning with exploring the data and identifying the elements that need attention before cleaning.
The DataOps approach provides a level of agility to the processing phase of the data journey that ensures data is managed more efficiently and consistently. DataOps techniques employ automation and continuous integration. This speeds up data preparation and increases reliability. All this leads to an even more refined dataset being cleaned.
How you clean your data depends on what the data is to be used for. So, data must be standardized to align with its ultimate objective. This involves transforming data structures into a common format. The data is then considered ‘clean’ and thus ready for modeling and analysis.
Processing and extracting data should be complemented with standardization for the sake of better efficiency in the data journey. DataOps ensures we have the capacity to transform this data into a common format, in an automated and repeated way so we can meet the data quality objectives.
Step 3: Modeling and analyzing data
The third step in the data journey allows us to extract insights into the processed data using advanced analytics. While Data Governance ensures data validity, DataOps provides agility. This ensures that analysts and data scientists enjoy the flexibility required to analyze experiments and perform iterative data modeling.
Data Modeling revolves around understanding the relationships – identified through analysis – between the various data types a business manages. This enables tracking data types better. Modeling also helps with unpacking how data can be used. It enhances the management and governance requirements needed to protect data.
The modeling process should be rooted in analyzing how data is being used by each business unit. Quality data models are beneficial in pursuing organizational goals through data analytics. Optimizing analytics performance, regardless of the business’s scope, drives effective business intelligence. Producing a correct, high-quality data model, designed for a purpose, significantly improves data analysis capacities and analytics. This ultimately boosts accurate decision-making, by assuring better performance and ease of measure creations.
Data Governance practices establish data relationships beforehand. DataOps support streamlining data model rollout, fostering better collaboration, and empowering teams to respond quicker to emerging insights. Data analysis, in turn, is made easy, with clear insights delivered from the higher agility provided. And robust analysis translates to a better capacity for visualizing data.
Step 4: Interpreting and visualizing data
The fourth and final step is interpreting and visualizing data. Here, data is compiled into a captivating story that provides answers to questions. This is where data use is most effective. Data Governance and DataOps principles come together during this fourth and final step.
The guidelines outlined by DataOps and Data Governance ensure that high-quality data provided in time is sufficiently enhanced at this stage.
The data visualization process transforms data into something that business users can comprehend visually. The trends and patterns extracted from data analysis can be seen and understood by converting data into a visual medium. However, before the proper visualization can be deployed to users, it is best to follow the correct approach to Analytics Experience.
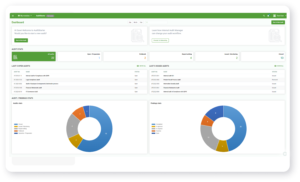
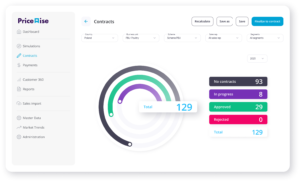
The charts, graphs, graphics, and other visual elements produced through visualizing data are often contained in dashboards and reports. These allow users to observe multiple data elements and images together for a more comprehensive story. The average dashboard displays between three and five charts or graphs at once. Variations in format can also assist in making things more compelling.
However one should also consider the dashboard’s role in providing quality insights or relevant data analysis. Generic dashboards, for example, could have a negative effect on insights and their interpretations. These data insights show how effective a good data experience can be.
According to Maciej Kłodaś, Head of UX at C&F, telling a data story well means the context and purpose of the data’s visualization must be clear. This means presenting data in a way that allows for more open interpretations. Understandings along multiple paths provide for different analysis goals, too. Dashboards are merely a type of data visualization tools. They assist the end user in navigating the data better. Every team is then empowered to draw their own conclusions along the way, developing unique interpretations.
Going from ‘data’ to ‘insight’ – reaching data maturity
These four steps in the data journey allow us to uncover and see data, turning into a company’s biggest asset. Hidden data is useless and doesn’t help organizations make decisions. By collecting data, processing, refining, and transforming it into visually comprehendible content that provides valuable insight, we can put it to work.
Finding, defining, and gathering the correct raw data means we can collect the right basic information. Once processed and cleaned, this data represents tangible information we can use. However, extracting data value from this resource requires models to ensure the information conforms with the standards and formats as they are necessary for us to begin analyzing data.
DataOps and Data Governance principles are crucial to the data journey. They inform and guide each step, enhancing our ability to visualize and interpret our data results more effectively. Relevant, accurate data is critical to effective analysis. The processes we use to ensure its veracity are vital to maintaining data authenticity in line with organizational goals and objectives.
In order for a company to become Data-Centric it is crucial to progress on the maturity scale for architecture, so that it becomes Innovative and Agile. This will allow for utilization of AI and ML, and foster innovation and experimentation. It also means that data architecture is highly adaptable/scalable to changing business needs allowing for quickly enhancing the existing data structure.
Visualizing data and the resulting insights created help people and companies make better decisions. It contributes to a better understanding of the business. We use them to improve things, change policies, and measure performance. This is why our data insights must be easily understood and interpreted.
Because without the data journey, we can’t see past the raw numbers at all. The journey that takes basic digital information from data to insight that informs important decisions is a part of every organization’s quest for better data. Begin your data journey toward data maturity today.
Would you like more information about this topic?
Complete the form below.


