Analytical Report Creation and the Cost of Analysis


Designing data experiences that work
Effective reporting and analytics are essential for turning raw information into clear, actionable insights. While various types of data analysis have unique requirements, this episode focuses on the usability and design factors that make any analytical report more effective. You’ll learn practical ways to create usability reports, apply eye-tracking metrics, and design dashboards people actually want to use. You’ll also discover how thoughtful design can reduce the cost of analysis and help teams make faster, more confident decisions.
Maximizing the impact of your analytical reports
A well-crafted analytical report can unlock real business value, from fewer errors to faster execution. We explore proven methods for creating reporting and analytics tools that align with your goals, improve user satisfaction, and make data an everyday asset. You’ll also discover how to communicate benefits clearly and build lasting adoption across your organization.
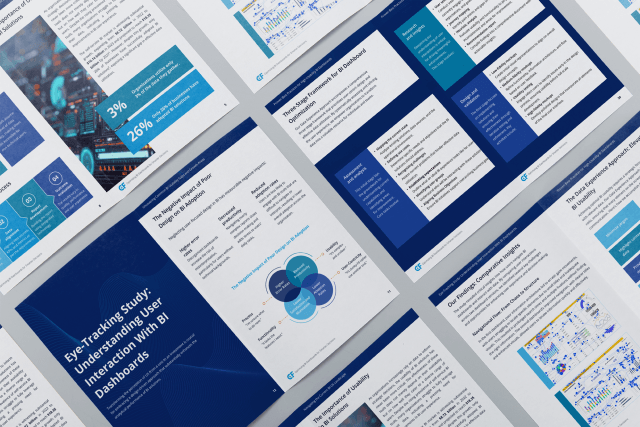
Download our e-book and start building dashboards users trust
Meet the expert

Łukasz Gładysz
UX Designer/Team Leader, C&FŁukasz is a Team Leader, UX/UI expert, and designer with a passion for strategy, processes, and problem-solving. Specializing in crafting intuitive interfaces, simplifying users’ lives, and visualizing large datasets effectively, Łukasz believes that well-designed UX empowers users to make better decisions and plays a key role in transforming complex data into clear and valuable insights. As a leader, Łukasz is dedicated to building an effective team and delivering solutions that address real user needs.
Let’s connect
Our engineers, consultants, and experts are here to help you uncover solutions tailored to your business needs. Whether you’re looking for targeted support or planning a complex digital transformation, we’re ready to help you achieve more.