The Data Problem No One Wants to Admit

Most organizations have no clear way to know which of their data investments are actually delivering value. They keep renewing contracts, buying new datasets, and building more dashboards, yet the real return on that spending remains a black box. Decisions about what to keep, reduce, or cut often come down to gut feel, habits, or whoever shouts loudest during budget season. 

Data spend keeps rising. Visibility into what that spend actually buys gets more difficult. Many teams have solid usage numbers from their data platforms, but those numbers sit disconnected from the business reality of people who use dashboards and reports in everyday work. Local markets sometimes buy their own data without central oversight. Priority commercial areas get lost in the noise. The result is often the same: organizations continue investing in assets with limited business impact while struggling to demonstrate the value of the assets that matter most. 

What Return on Data Actually Delivers

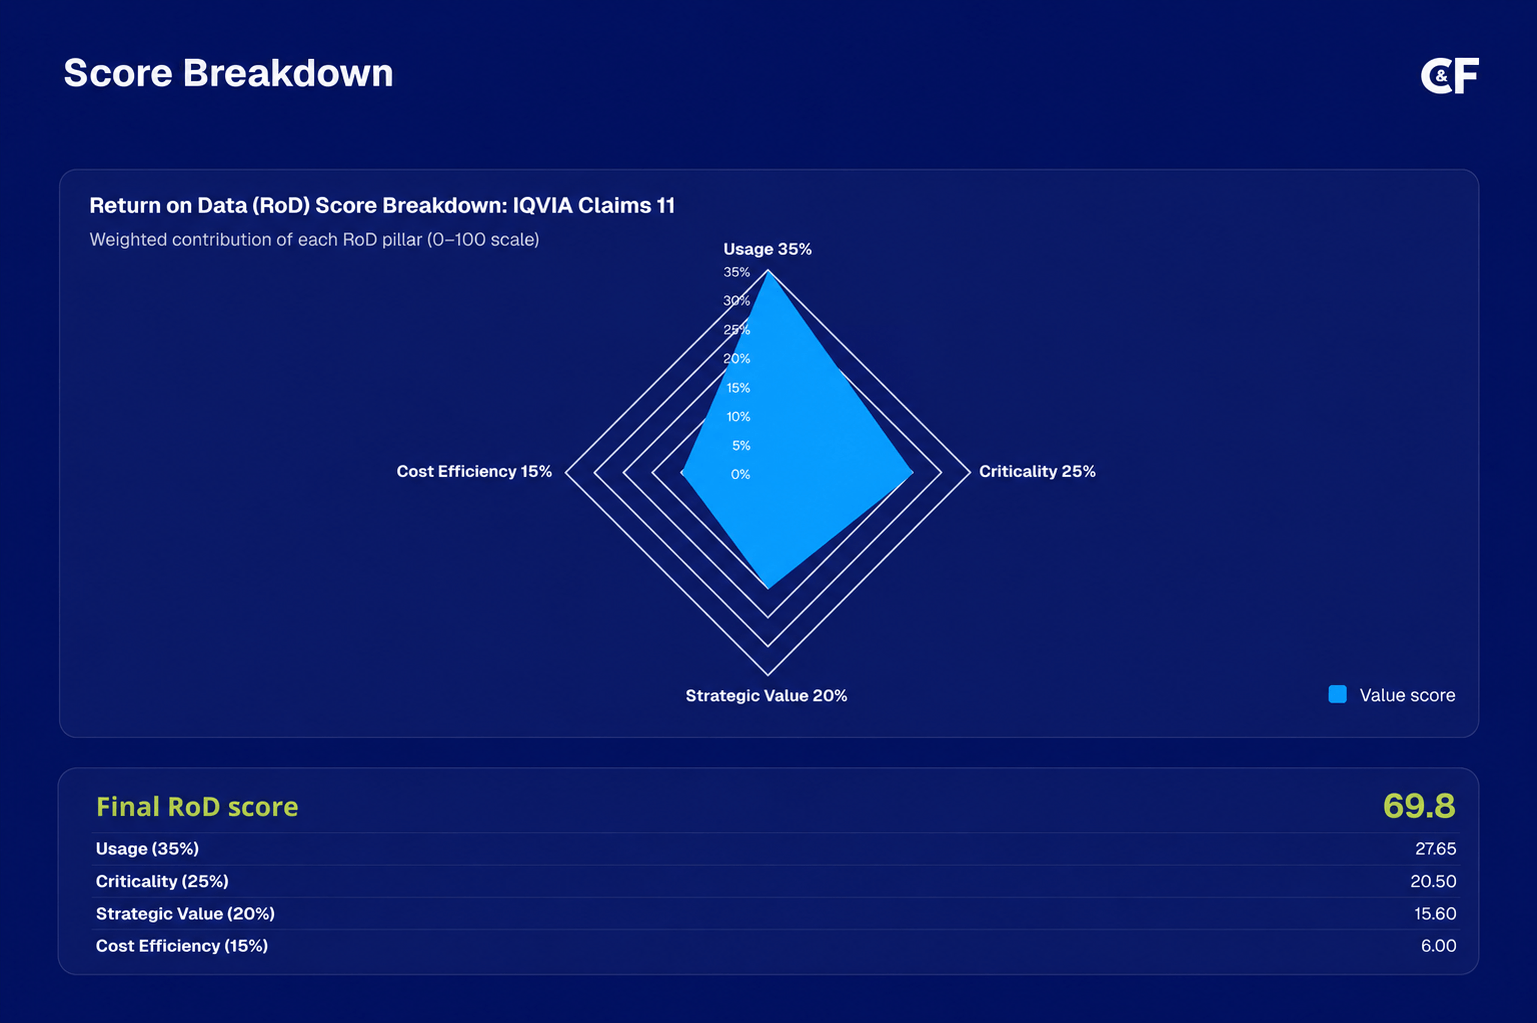
We give you one clear, defensible number for every major data asset: the Return on Data Score. It combines how much the asset is actually used, how critical it is to the people who depend on it, and how well it supports your priority business areas. With that single score you can finally have honest, evidence-based conversations about what to keep, what to reduce, and what to let go. 

  • See which assets are genuinely used and which ones are quietly collecting dust 
  • Understand which reports and dashboards support real commercial priorities 
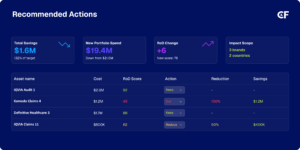
  • Know where to reduce spend on data assets, and where to double-down because the value is there 
  • Give your procurement and data teams a shared, objective language for investment decisions 

Where It Creates Value 

In projects with enterprise life sciences organizations, this approach has helped identify unused or low-value data assets, support decommissioning decisions, reduce ongoing infrastructure and licensing costs, and free up budget for higher-priority analytics initiatives. The key value drivers are: 

Icon showing two people in front of a screen

Vendor negotiation leverage

Procurement teams enter renewal conversations armed with hard numbers. You see exactly how much (or how little) a third-party dataset is used across reports and teams. That evidence gives you real leverage to negotiate better rates or drop contracts that no longer justify their cost. 

Cloud cost control

Cut wasted compute spend. Identify dashboards and reports that consume heavy resources but deliver limited business value, then right-size warehouses and eliminate low-utility workloads without losing critical insights. 

Cost accountability across the business

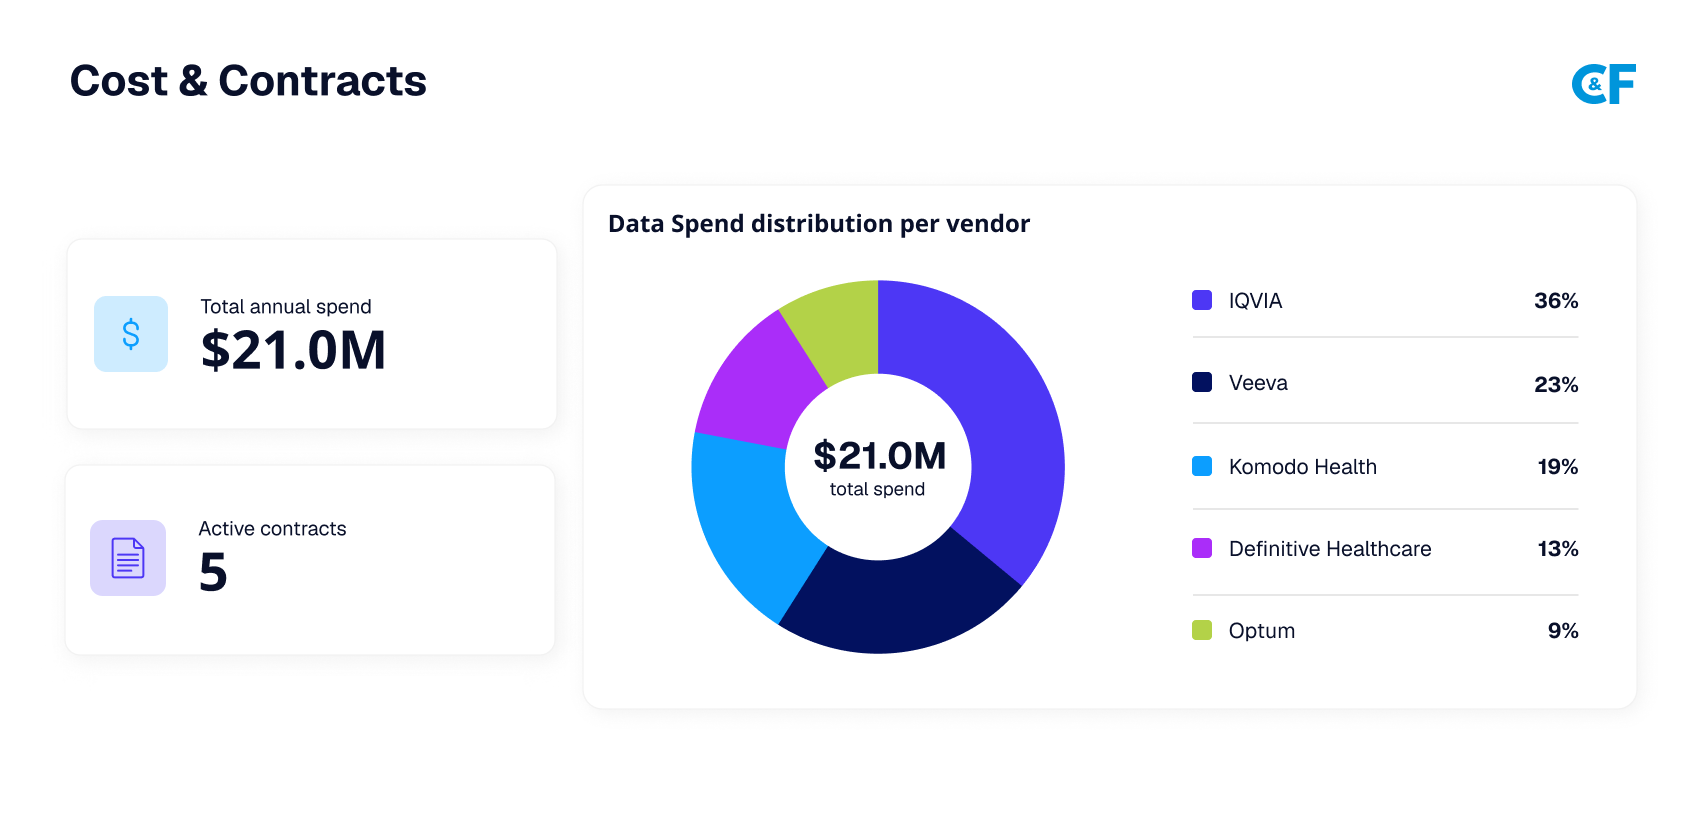
Make data costs visible where they are actually consumed. Allocate compute and dataset purchase costs directly to the teams and departments using them through dashboards and reports. This creates transparency and drives more disciplined data usage across the organization. 

Investment prioritization

Identify the datasets, dashboards, and analytical assets that deliver the greatest business value. Use objective evidence to support renewal, expansion, and modernization decisions, ensuring budget is directed toward the assets that have the biggest impact on business outcomes. 

How We Make It Real

We connect usage signals from your existing data platforms with structured input from the people who actually use the data. A short, targeted survey captures how critical each report or dashboard is to someone’s daily work and which priority business areas it supports. We then combine that human context with objective usage patterns, cost information, and governance signals into one transparent score. 

The score is built from four main inputs: actual usage volume and trends, end-user criticality ratings, alignment with priority business areas and commercial goals, and opportunities to optimize cost or scope. No single factor dominates. The result is a balanced, repeatable view that procurement and business stakeholders can both trust. 

Why This Matters Now

Data budgets are under more scrutiny than ever. At the same time, the number of datasets, dashboards, and tools keeps growing. Without a clear way to connect spend to value, organizations end up funding the loudest requests instead of the highest-impact ones. Return on Data gives you the visibility and the language to change that dynamic before the next budget cycle. 

How We Work With You

Return on Data is designed to build on what you already have. We integrate with your existing data platforms and processes, combining usage data, business context, and cost information into a practical framework for decision-making. The approach is deliberately phased so you see value quickly and can expand at your own pace. 

  • Start with usage visibility and a focused set of high-spend assets 
  • Add business context through a lightweight survey 
  • Build the scoring model together so it reflects your actual priorities 
  • Roll out the dashboard and use it to drive real renewal and optimization decisions 

If you are tired of making multi-million-dollar data decisions with incomplete information, we should talk. We help teams move from gut feel and politics to clear, evidence-based choices about where their data spend creates real value and where it does not. 

Ready to find our what you data is actually worth?

See Our Solutions

Advising on and leveraging technologies to create scalable solutions. On-premise and cloud.

Explore our Solutions

Let's talk about a solution

Our engineers, top specialists, and consultants will help you discover solutions tailored to your business. From simple support to complex digital transformation operations – we help you do more.