

- 1. Why traditional ROI approaches fall short
- 2. Data investments are spread across multiple cost centers
- 3. Usage is easier to measure than value
- 4. The hidden challenge of indirect value creation
- 5. The problem of unused and underutilized data
- 6. Why AI is making the challenge more urgent
- 7. A different approach to measuring Return on Data
- 8. Measuring value is an ongoing capability
Organizations have never invested more in data than they do today. The global big data market is currently estimated around $320-450 billion and is expected to double by 2030.
In enterprise orgs, data platforms, analytics tools, external datasets, dashboards, cloud infrastructure, AI initiatives, governance programs, and data teams all compete for budget. Most business leaders understand that data has become a strategic asset and are willing to invest accordingly.
Yet when executives ask a seemingly simple question: “What value are we getting from all of this?” a trustworthy, verifiable answer is difficult to get. Most organizations can tell you how much they spend on data. Far fewer can confidently explain which data investments create value, which ones underperform, and where additional investment would generate the greatest impact.
This visibility gap creates challenges across the business. Data leaders struggle to justify budgets. Business stakeholders question the value of analytics initiatives. Procurement teams renegotiate data contracts without a clear understanding of actual usage. And as AI investments accelerate, the pressure to demonstrate measurable returns continues to grow.
At C&F, we’ve been helping organizations manage and derive value from commercial data for more than 25 years. Much of that experience comes from working with some of the world’s largest pharmaceutical and life sciences companies, where data has long been a strategic asset and a significant line item on the budget.
Over the years, we’ve seen the same challenge emerge again and again in conversations with commercial, analytics, and data leaders: organizations know they’re investing heavily in data, but they often struggle to quantify the return. In recent years, as investments in data, analytics, and AI have accelerated significantly, this challenge has become even more pressing.
The problem is not a lack of data. In many cases, organizations have more information than ever before. What makes it challenging is the fact that measuring the return on data is fundamentally different from measuring the return on most other business investments.
Why traditional ROI approaches fall short
Calculating ROI is relatively straightforward when the relationship between investment and outcome is direct. If a company purchases a machine that increases production output by 20%, the value can be measured against the cost. If a marketing campaign generates qualified leads that become customers, the return can be estimated with reasonable confidence.
Data rarely works this way. A single dataset may support dozens of dashboards, reports, and analytical models. Those assets may be used by multiple departments across different business processes. Insights generated from the data influence decisions, which then contribute to operational improvements, cost reductions, revenue growth, or competitive advantage.
By the time value is created, the connection to the original data investment is often difficult to trace. This is particularly true in industries such as life sciences, where commercial decisions may be influenced by multiple internal and external data sources, each contributing a piece of the overall picture.
This creates a challenge that many organizations have not fully solved: understanding how data moves from an expense on a budget spreadsheet to a measurable business outcome. Without that visibility, ROI discussions often rely on assumptions rather than evidence.
Data investments are spread across multiple cost centers
One reason measuring return is difficult is that data spending rarely exists in a single place.
Organizations typically invest across several categories:
| Cost Category | Examples |
| External Data | External data providers, syndicated data, market intelligence sources |
| Infrastructure & Platforms | Data warehouses, lakehouses, cloud infrastructure, analytics and BI platforms |
| People & Delivery | Data engineering teams, internal reporting and analytics teams |
| Governance & Management | Data governance initiatives, data quality programs, compliance efforts |
| Advanced Analytics & AI | Data science programs, machine learning initiatives, AI solutions |
These investments are often managed by different teams with different priorities and success metrics. The result is fragmented visibility.
A business unit may know how much it spends on a particular dataset. The data platform team understands infrastructure costs. Finance tracks vendor contracts. Analytics teams focus on adoption and reporting delivery.
But what we learned is that very few organizations have a consolidated view that connects all of these investments to the value they generate. As spending grows, this fragmentation becomes increasingly difficult to manage.
Usage is easier to measure than value
Working with clients, we see that many organizations already track some form of data usage. They know how many users access dashboards. They can see query volumes. They might even understand platform consumption and storage trends. Modern analytics environments provide a significant amount of operational visibility.
But usage alone does not equal value. If you start measuring the performance of your team based on how much they use a specific dashboard, they will access it every day. It’s not dissimilar to a recent trend in inflating AI use via “token maxing”. But this usage won’t necessarily contribute to making better decisions.
Likewise, a dataset used by only a handful of people may be critical to a highly valuable business process. This distinction is important because organizations often focus on what is easiest to measure rather than what matters most.
Usage metrics are useful. They provide an indication of adoption and can highlight underutilized assets. However, they only represent one part of the picture. Understanding business impact requires additional context.
Questions such as:
- Which decisions does this data support?
- Which teams rely on it?
- What happens if it becomes unavailable?
- Does it contribute to revenue growth, cost reduction, risk mitigation, or operational efficiency?
These questions are harder to answer, but they are essential for understanding return.
The hidden challenge of indirect value creation
Another obstacle is that data often creates value indirectly. Consider a sales dashboard used by regional managers. The dashboard itself does not generate revenue.
However, it may help identify underperforming territories, improve forecasting accuracy, and support more effective resource allocation. Those decisions can influence commercial performance over time.
In pharmaceutical and life sciences organizations, commercial teams often rely on a combination of internal sales data, market intelligence, prescription data, claims data, and third-party datasets to guide territory planning, targeting, and market access strategies. The value is created through better decisions, not through the data asset itself.
Similarly, a supply chain dataset may support inventory optimization. The value appears in reduced carrying costs and improved service levels rather than in the dataset itself. The relationship between data and business outcomes is real, but it is not always linear.
Organizations that attempt to measure data ROI using only direct financial attribution often find themselves frustrated. The goal is not to create a perfect one-to-one connection between every dataset and every dollar of value generated. Instead, the objective should be to improve visibility into how data supports decisions and outcomes across the business.
However, all this is not to say that measuring the data ROI is a fool’s errand. It is possible, and can lead to several interesting discoveries.

Internal Developer Platforms: The Missing Dashboard in Your Data Platform
In this episode of C&F Talks, Konrad Madej and Maciej Kłodaś discuss internal developer platforms and what they change for data teams. They cover how to spot the friction that justifies building…

From Vision to Value: A Practical Take on Industry 4.0
A practical conversation on Industry 4.0 that cuts through hype and shows why digital transformation succeeds through strong data foundations, realistic maturity goals, and human-centric change.

Is the Animal Health Industry Ready for AI?
In this episode of C&F Talks, Michał Osuch and Maciej Kłodaś discuss whether the animal health industry is ready for AI. They explore practical use cases, common adoption challenges, and the steps…

Commercial Excellence in Pharma: From Data Silos to Autonomous Growth
Commercial Maturity Model for pharma: move from data silos to autonomous growth. Heath Durrans on assessing capabilities and building realistic roadmaps. Listen to the episode now!

Why Enterprises Should Treat Data Like a Living Organism
An in-depth conversation on how pharma organizations can treat data like a living organism and build healthier, AI-ready data environments through strong foundations, governance, and organizational…

IoT Solutions and Product Tracking in the Life Sciences Industry
Discover how IoT technologies are transforming operational visibility in the life sciences industry. Explore practical insights from our successful pharma projects.

Next Best Action in Pharma Sales
Learn how pharma companies use AI-driven insights and predictive analytics to deliver Next Best Action at scale. A practical look at driving engagement and results.
The problem of unused and underutilized data
Most organizations discover an uncomfortable reality when they begin examining data usage closely. Namely: not all our expensive data assets are actively used. Over time, companies accumulate datasets, reports, dashboards, and analytical solutions created for specific projects, teams, or business initiatives. Some continue to provide value. Others gradually lose relevance. Yet many remain in place.
From our experience, it’s extremely rare to find an organization that decommissions data assets at the moment they become obsolete. It’s much more common to keep them “just in case”, then lose sight of them, and continue to maintain them for months or even years. The costs continue as organizations pay for licenses, storage, processing, maintenance, and support.
In life sciences, this challenge can be particularly expensive. Organizations often invest heavily in commercial datasets from providers such as IQVIA and others because these assets are critical to understanding markets, customers, and performance.
The question is not whether these datasets are valuable; they often are. But do you have visibility into how those datasets are actually being used, and what they contribute to?
Do teams know which IQVIA datasets are actively supporting business decisions? Which reports, dashboards, and analytical processes depend on them? Which subscriptions are heavily utilized, and which may no longer justify their cost?
Many organizations simply don’t know. Without visibility into actual usage, it becomes difficult to distinguish between valuable assets and unnecessary spending.
Moreover, this challenge extends beyond cost optimization. Unused assets increase complexity. They create governance overhead. They make environments harder to manage and can contribute to confusion about which sources should be trusted.
And we’re not trying to say that organizations need less data. They need a better understanding of which data creates value.
Why AI is making the challenge more urgent
The growing interest in AI is bringing renewed attention to data value. Most AI initiatives depend on existing data foundations. The quality of models, recommendations, and automated decisions is directly influenced by the data that supports them.
However, many organizations are approaching AI investments without fully understanding the value of their current data landscape. This creates risk.
If a company cannot determine which datasets support important business decisions today, it becomes significantly harder to evaluate the return on future AI investments.
Before expanding data spending through AI initiatives, organizations benefit from understanding:
- Which data assets are actively used
- Which assets support critical decisions
- Where costs are concentrated
- Where duplication exists
- Which investments create measurable business value
These insights provide a stronger foundation for future innovation.
A different approach to measuring Return on Data
As I mentioned, data ROI can be measured. The challenge is that traditional measurement approaches struggle with capturing the full picture.
Based on decades of work with enterprise clients, including many from pharma and life sciences, we believe a more practical approach starts by connecting four key elements:
| Component | Description |
| Data investment | The costs associated with datasets, platforms, infrastructure, analytics tools, and supporting teams. |
| Data usage | How data is consumed across dashboards, reports, applications, and business processes. |
| Business decisions | Where data influences planning, operations, customer engagement, and execution. |
| Business value | The outcomes generated through improved decisions, including revenue impact, cost optimization, efficiency gains, and risk reduction. |
When these elements are connected, organizations can move beyond assumptions and develop a clearer understanding of how data contributes to business performance.
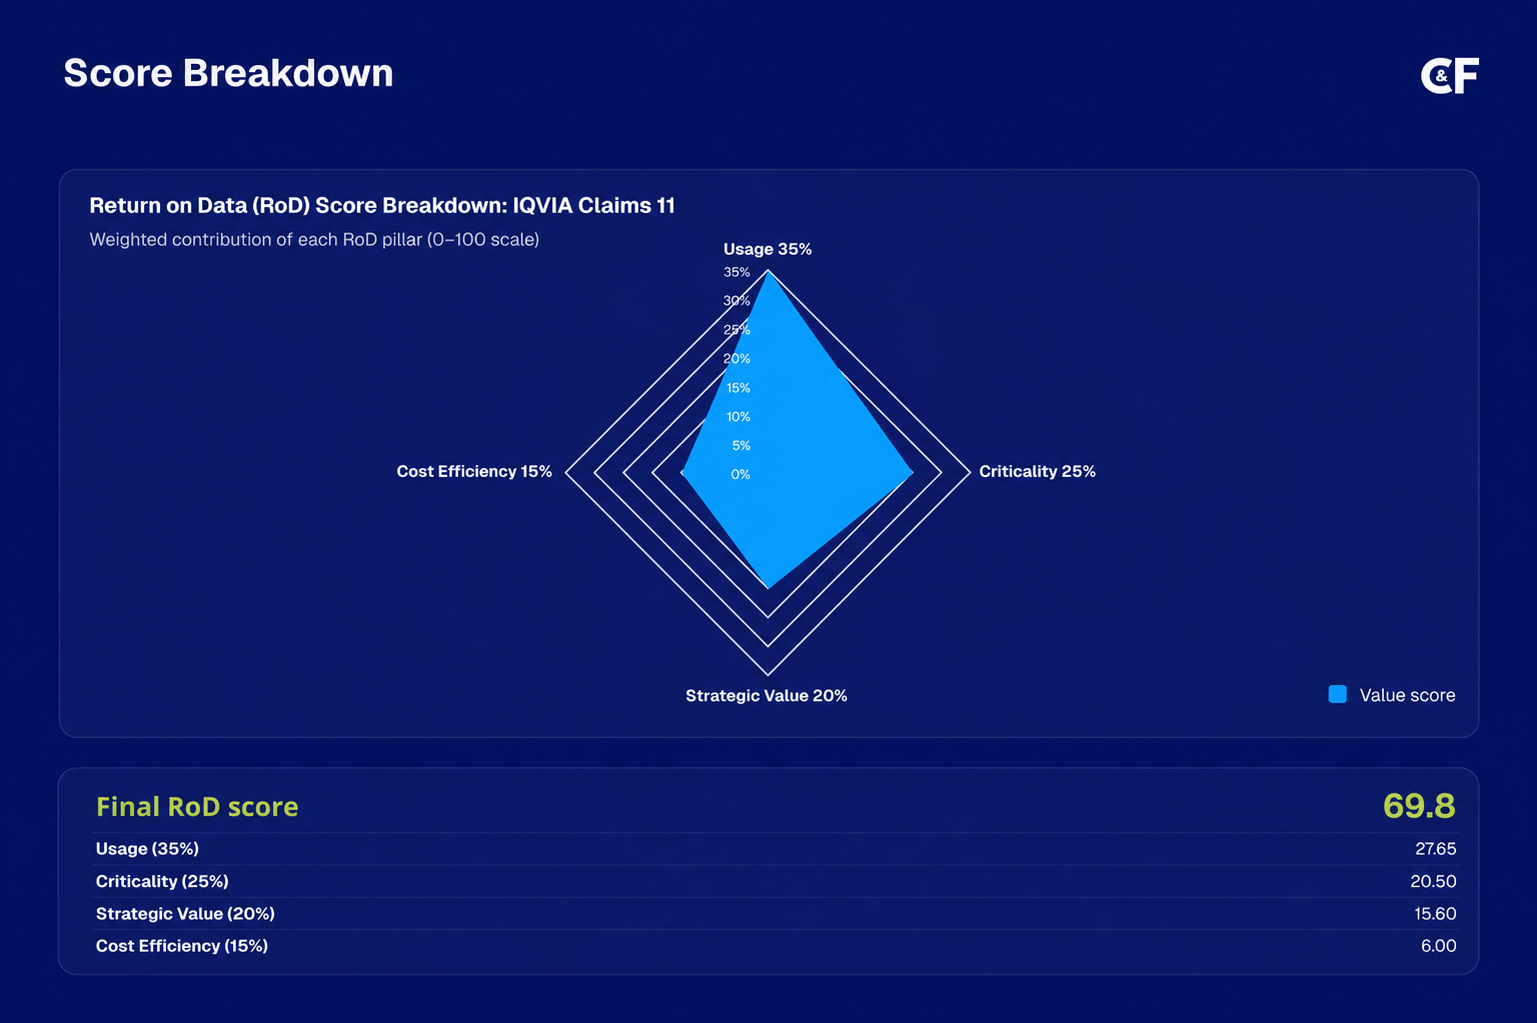
Based on that, we came up with a way to assess every major data asset and assign it a Return on Data score. A single number that makes it easy to understand the impact and business value it brings.
This visibility supports better investment decisions, more effective governance, and stronger alignment between analytics initiatives and business priorities.
Measuring value is an ongoing capability
One of the most common misconceptions about data ROI is that it can be solved through a single analysis. In reality, business priorities change. Data usage evolves. New platforms are introduced. Existing assets become obsolete. AI initiatives create additional complexity.
Understanding Return on Data is therefore not a one-time exercise. It is an ongoing capability that helps organizations continuously evaluate where data creates value and where improvements are needed.
The organizations that do this well are not necessarily the ones spending the most on data. They simply did the homework of getting to understand how data supports decisions, where it delivers measurable outcomes, and how to align future investments with business priorities.
As data ecosystems continue to grow, that visibility becomes increasingly important. Partially to cut unnecessary costs, but more importantly, to ensure that data investments contribute to meaningful business results.
Because ultimately, the goal is to create more value from the data you already have. Our Return on Data approach helps organizations gain visibility into data usage, adoption, costs, and business impact; providing the insights needed to optimize investments and align analytics with business priorities.
Would you like more information about this topic?
Complete the form below.