
- 1. Setting The Scene: The “NewPharm” Crisis
- 2. Step 1: Asking the Right Question (Defining the problem)
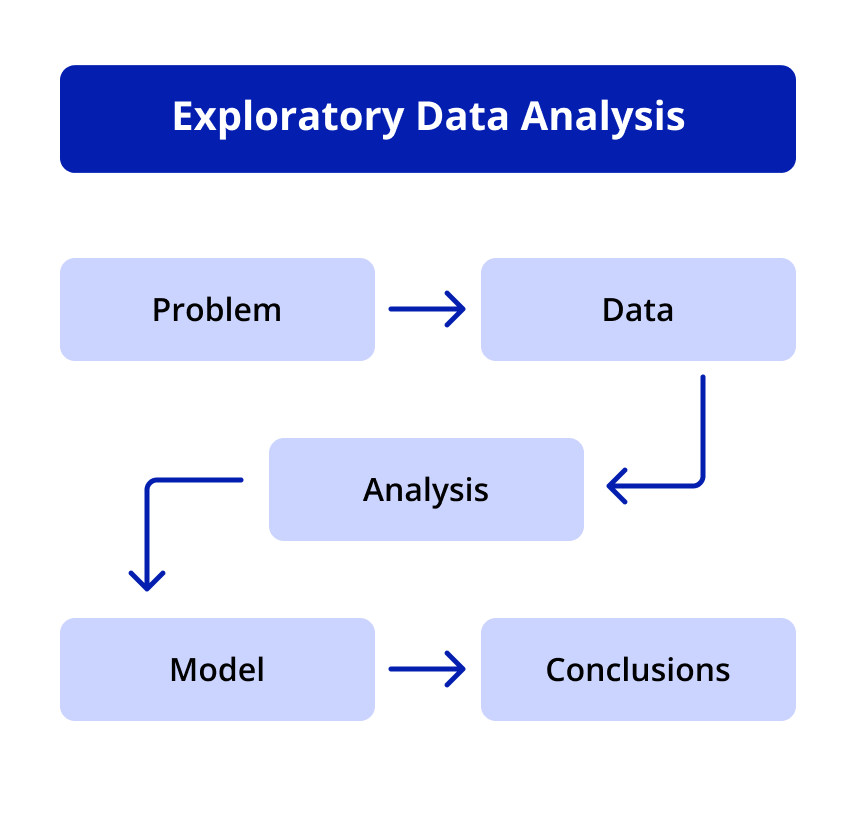
- 3. Step 2: Background Research (Exploratory Data Analysis)
- 4. Step 3: Formulating the Hypothesis
- 5. Step 4: The Experiment (A/B Testing)
- 6. Step 5: Evaluating the Results (Data Analysis)
- 7. Step 6: Actionable Insights (Communication and Deployment)
- 8. The Infinite Loop
- 9. Summary
- 10. FAQ
Without scientific structure, data analysis is sophisticated guesswork. Instead of reacting to executive intuition, a data science team asks a precise question, locates the actual cause, tests a hypothesis in a controlled experiment, and delivers findings as a decision brief with ranked options and estimated risk. That is Decision Intelligence in practice — and why organizations that apply it make better calls faster than those running on assumptions.
When we hear “Data Science,” our minds often jump straight to complex neural networks, long Python scripts and futuristic AI. However, the true superpower of a data scientist isn’t just writing code, it’s thinking like a scientist. Without the rigorous structure of the scientific method, data analysis is just a sophisticated guessing game.
This thinking framework has a name: Decision Intelligence. It’s a discipline combining data, causal models, and business context to transform analysis into concrete, well-founded decisions. To understand how this works in the real world, let’s look at a practical story: a case study showing how the scientific method can help a business and improve patient outcomes.
Setting The Scene: The “NewPharm” Crisis
Imagine a pharmaceutical startup called NewPharm. They recently launched a new companion app designed to help patients manage a newly released hypertension medication.
For the first few months, user acquisition was great. However, the Chief Medical Officer noticed a worrying trend: a massive drop-off in medication adherence exactly around the four-week mark. Patients were deleting the app and, worse, stopped their treatment.
The executive team, lacking decision intelligence, started guessing: “the app interface is too confusing for older patients!” one argued. “The medication must have severe side effects we didn’t anticipate,” said another. If the team blindly followed these guesses, they might have spent millions redesigning the app or initiating unnecessary clinical safety reviews. Instead, they applied the scientific method.
The scientific method characterizes science since at least 17th century, although it’s been developed from ancient and medieval practices.
Its main objective is a testable hypothesis, created through inductive reasoning, tests through experiments and statistical analysis, and adjusting or discarding the hypothesis based on the results. For simplicity of the narrative, we excluded deductive reasoning from this article
Step 1: Asking the Right Question (Defining the problem)
The scientific process always starts with a clear, focused question. Instead of asking the vague, panicked question, “Why are patients quitting?”, the data science team framed the business and clinical problem precisely:
“What specific behavioral or demographic factors correlate with patients abandoning their medication logs between week 3 and week 4 of treatment?”
At this point, the crucial actions were:
- Identify the vague assumption: don’t rely on broad, generalized questions driven by guesses
- Frame a precise, measurable hypothesis: define the problem by looking for specific variables that correlate with the issue
- Decision framing: before diving into data, define what decision this analysis should inform and what actionable options are on the table.
- Define the Target Variable and establish baseline metrics: formulate the business problem as a machine learning task and metrics used to evaluate the results.
Step 2: Background Research (Exploratory Data Analysis)
In traditional science, you read past literature. In data science, you dive into databases. This is the Exploratory Data Analysis (EDA) phase.
The team gathered a collection of data points: patient age, reported side effects, app session lengths, and prescription types. They visualized the data and noticed a hidden pattern: patients who dropped off were not reporting higher side effects, nor were older patients struggling more than younger ones. However, there was a stark correlation with the dosage schedule. Patients prescribed a “twice-a-day” regimen were churning at a 60% higher rate than those taking the pill once a day in the morning.
To recap, this step requires you to:
- Gather your dataset: pull a wide collection of relevant information from your databases (e.g., patient age, reported side effects, app session lengths).
- Visualize and rule out false leads: look at the data to disprove initial guesses
- Identify hidden correlations: find actual patterns in the data
- Statistical distribution analysis: analyze continuous variables using histograms or plots and assess categorical relationships using statistical tests
Step 3: Formulating the Hypothesis
Now, the team needed a testable assumption. Digging deeper into the EDA, they found that morning doses were almost always logged, but the evening doses were frequently missed, possibly leading to patient frustration and eventual abandonment of the entire regimen.
They formulated a strict, data-driven hypothesis:
“If we replace static evening reminders (e.g., a generic alarm at 8:00 PM) with a Machine Learning-driven ‘Smart Reminder’ that pings the patient when their phone activity indicates they are stationary and relaxed, the 4-week drop-off rate for twice-a-day patients will decrease by at least 20%.”
In this scenario, the aspects that inform a measurable, data-driven hypothesis are:
- Causal chain mapping: map the causal path from root cause to observed outcome before proposing interventions.
- Create a testable assumption: propose a specific technical solution and state the quantifiable, expected outcome.
- Feature engineering for ML: transform raw inputs (like accelerometer and screen-time data) into predictive features.
- Model selection and training: split the data into training, validation, and test sets to and train the model.
- Hyperparameter tuning: use optimization technics and fine-tune the model.
Step 4: The Experiment (A/B Testing)
A hypothesis needs to be tested; the data team designed a rigorous A/B test:
- Control Group: 50% of the twice-a-day patients continued receiving the standard, static push notifications at fixed times.
- Test Group (Variant B): 50% of the twice-a-day patients were enrolled in the new predictive model, which analyzed accelerometer and screen-time data to trigger reminders at optimal, personalized moments.
The team let the experiment run for six weeks to collect enough data to reach statistical validity. At this point, the crucial aspects are:
- Design control and test groups: select a portion of your users to maintain the current baseline results and apply your proposed solution to the rest.
- Power Analysis: conduct a statistical power analysis prior to launch to determine the exact sample size needed to confidently detect the 20% drop-off reduction.
- Run for statistical validity: let the experiment run long enough to collect conclusive data.
Step 5: Evaluating the Results (Data Analysis)
Once the experiment concluded, it was time to look at the hard numbers. The data team evaluated the adherence metrics:
| Group | Reminder Type | Average Evening Doses Missed (per week) | 4-Week Abandonment Rate |
| Control | Static Time | 3.4 | 38% |
| Test | ML-model-driven Trigger | 1.1 | 14% |
The results were statistically significant. The abandonment rate in the test group didn’t just drop by the hypothesized 20%, it plummeted by 24 percentage points. The math proved the issue wasn’t the app design or the drug side effects; it was the friction of having to remember the evening dose during a busy schedule.
The crucial parts of interpreting the data and evaluating the results are:
- Compare the metrics: evaluate the specific metrics you set out to change between the two groups.
- Hypothesis Testing (p-values): conduct statistical tests on the abandonment rates to see if your hypothesis is statistically significant, and the results meet your set goals.
- Decision threshold: determine upfront what level of evidence is sufficient to act – not every statistically significant result is viable for deployment.
Step 6: Actionable Insights (Communication and Deployment)
Data is of no use if it doesn’t drive action. The lead data scientist presented these findings to the medical and executive boards, translating the data into clinical and business value:
“Deploying this predictive model keeps patients on their treatment plan, improving their cardiovascular health outcomes and saving us an estimated $2.4M annually in lost prescription renewals.”
But a number alone doesn’t close the decision loop. The data scientist framed the recommendation as a decision brief: three deployment options (full rollout, phased rollout, extended pilot), each with projected costs, risk exposure, and confidence intervals around the expected adherence lift. This gave the board not just evidence, but a clear menu of actions weighted by uncertainty: the essence of decision intelligence.
Management immediately prioritized deploying the ML Smart Reminder model to all app users globally. During this step, the most important parts are:
- Translate data into value: present the findings to decision-makers in terms of business and real-world impact.
- Decision brief: package findings as a clear recommendation with ranked options, trade-offs, and confidence levels – not just a data dump.
- Quantify uncertainty: present confidence intervals and worst-case scenarios alongside point estimates so stakeholders can weigh risk before committing.
- CI/CD Pipeline Integration: package the validated ML model into a containerized microservice and deploy it into the production environment via a continuous integration pipeline.
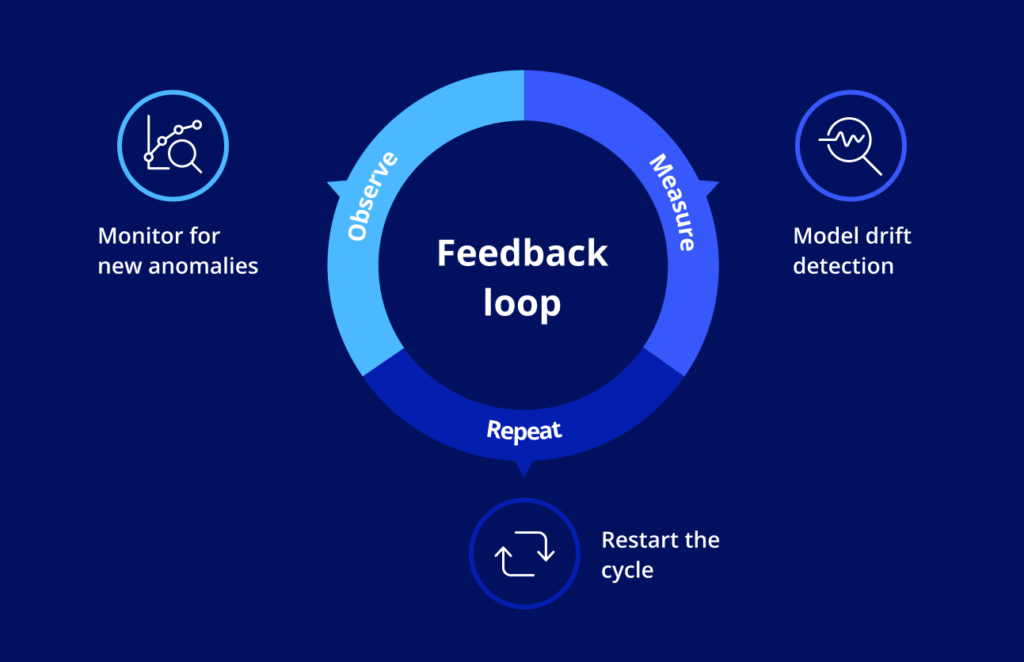
The Infinite Loop
The beauty of the scientific method is that it never truly ends. Fixing the evening adherence issue was a massive win, but the data team soon noticed a new anomaly: the smart reminders were less effective on weekends.
The cycle began again: asking a new question, exploring weekend behavioral data, and forming a new hypothesis about weekend routine disruptions.
Each decision generates new data, and each new dataset informs the next decision. This is thecore feedback loop of decision intelligence. An organization that treats each outcome as input for the next cycle doesn’t just react to uncertainty; it learns through it.
The scientific method in data science is, ultimately, the engine that powers this loop: a systematic way of turning ambiguity into informed action.
What’s crucial for making it a part of daily operations, and not a one-off optimization process are the following actions:
- Monitor for new anomalies: keep an eye on the deployed solution to see where it falls short (e.g., noticing the new smart reminders were less effective on weekends).
- Model Drift Detection: implement automated statistical checks (such as the Population Stability Index) on incoming live data to detect “concept drift” where user behavior changes over time.
- Restart the cycle: use the new anomaly to begin the scientific process over again.
Summary
Data science efforts that are not tied to business outcomes can be often seen as inefficient or redundant. While aligning the scientific methodology of “doing it right” with fast-paced business reality can sometimes be a challenge, it’s crucial to avoid mistakes or acting on misguided assumptions.
The scenario described in this article is fictional, but it’s closely related to what we see in client projects. Working with some of the largest enterprises in pharma and life sciences, we know the challenges of turning data into decision intelligence that works in daily operations. We’re happy to leverage our vast experience to support the decision-making in your organization.
FAQ
Does applying the scientific method slow down business decision-making?
It adds structure upfront, but less than reversing a wrong decision costs. In the NewPharm case, skipping EDA would have sent the team toward an app redesign or a safety review — neither would have worked.
What’s the difference between standard data analysis and Decision Intelligence?
Data analysis tells you what happened. Decision Intelligence adds what to do about it. The output is a brief with ranked options and confidence levels, not a dashboard or a findings report.
Our data is messy and incomplete. Can we still use this approach?
Yes. The EDA phase exists partly to rule out false leads and calibrate what the data can actually support. What the approach cannot absorb is skipping data quality assessment and treating noisy inputs as reliable evidence.
Who needs to understand this — data scientists or business leaders?
Both. Data scientists need it to avoid confirmation bias. Business leaders need enough fluency to ask the right questions: what was the control group, how long did the test run, what is the confidence interval. Analysis that neither side fully owns tends to be technically correct and operationally ignored.
How do we know when to restart the cycle?
A performance anomaly in the deployed solution is the usual signal — something the model handles worse than expected, or a behavioral pattern the original training data did not capture. Monitoring for those anomalies is what keeps Decision Intelligence from becoming a one-time project.
Would you like more information about this topic?
Complete the form below.